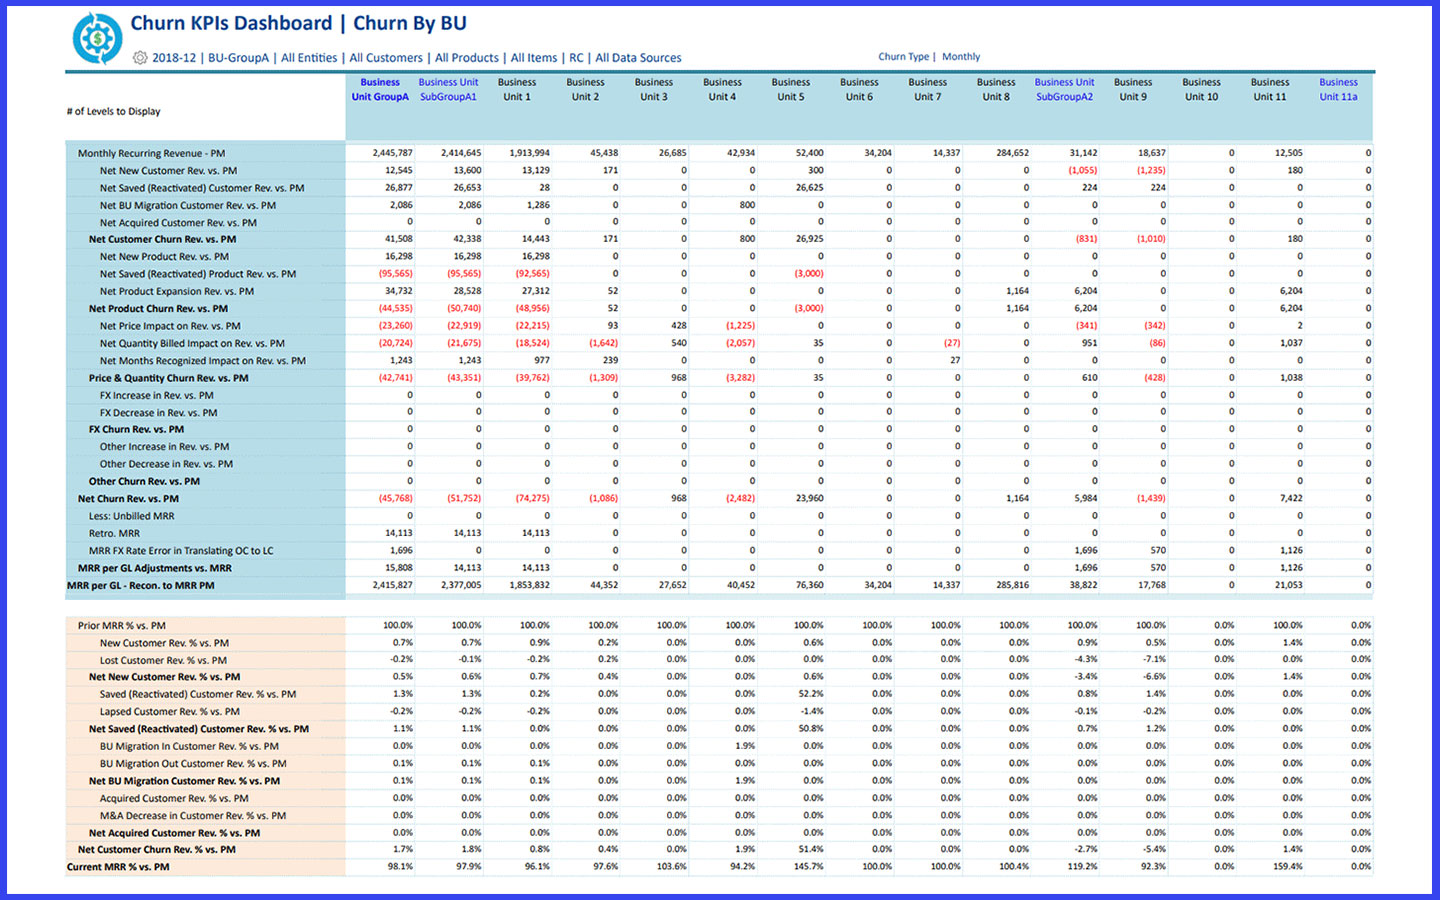
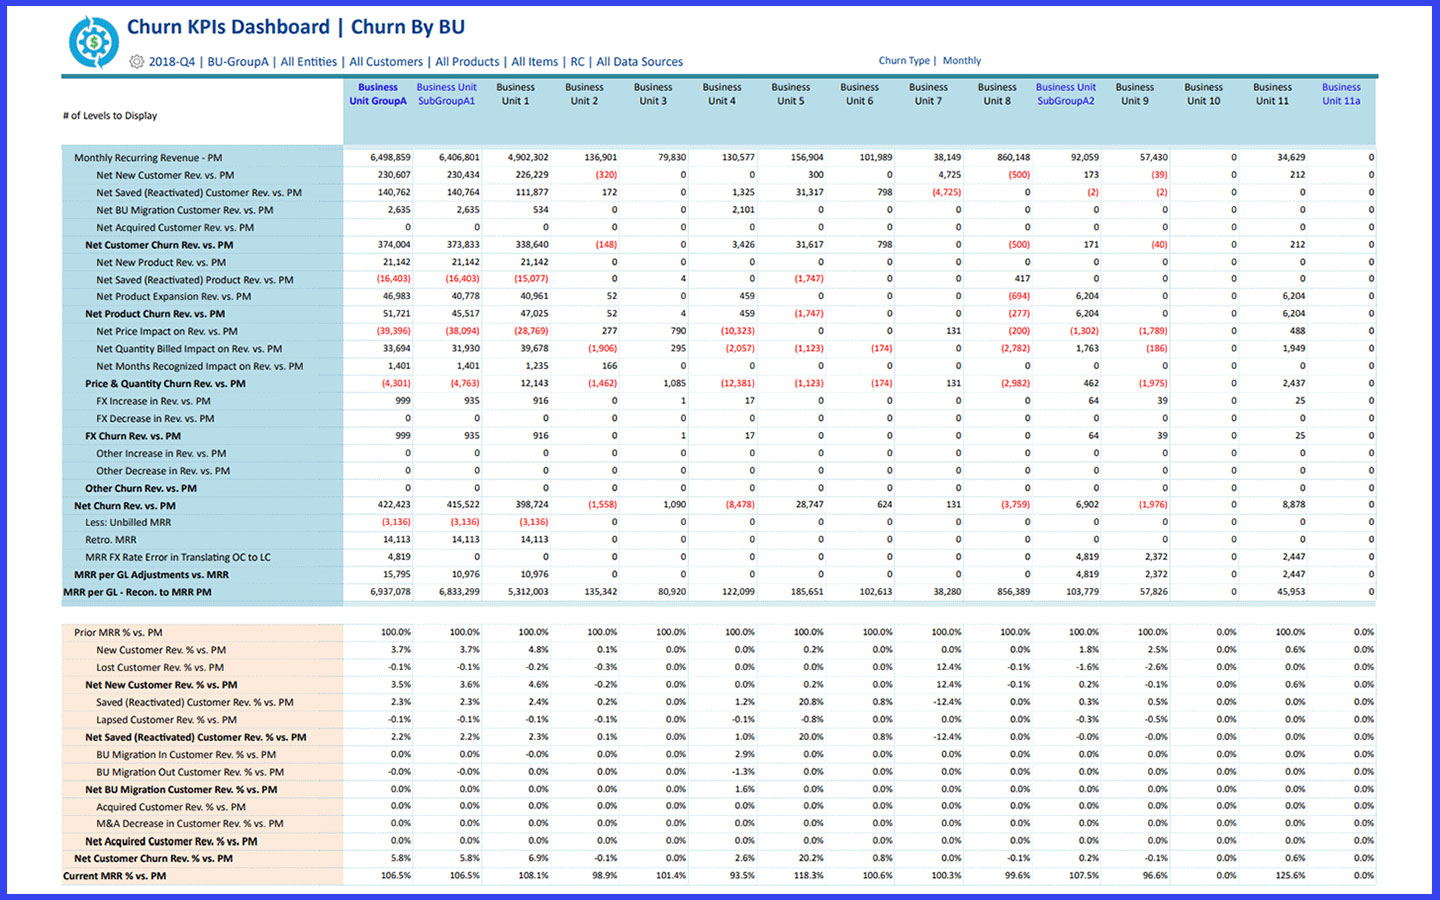
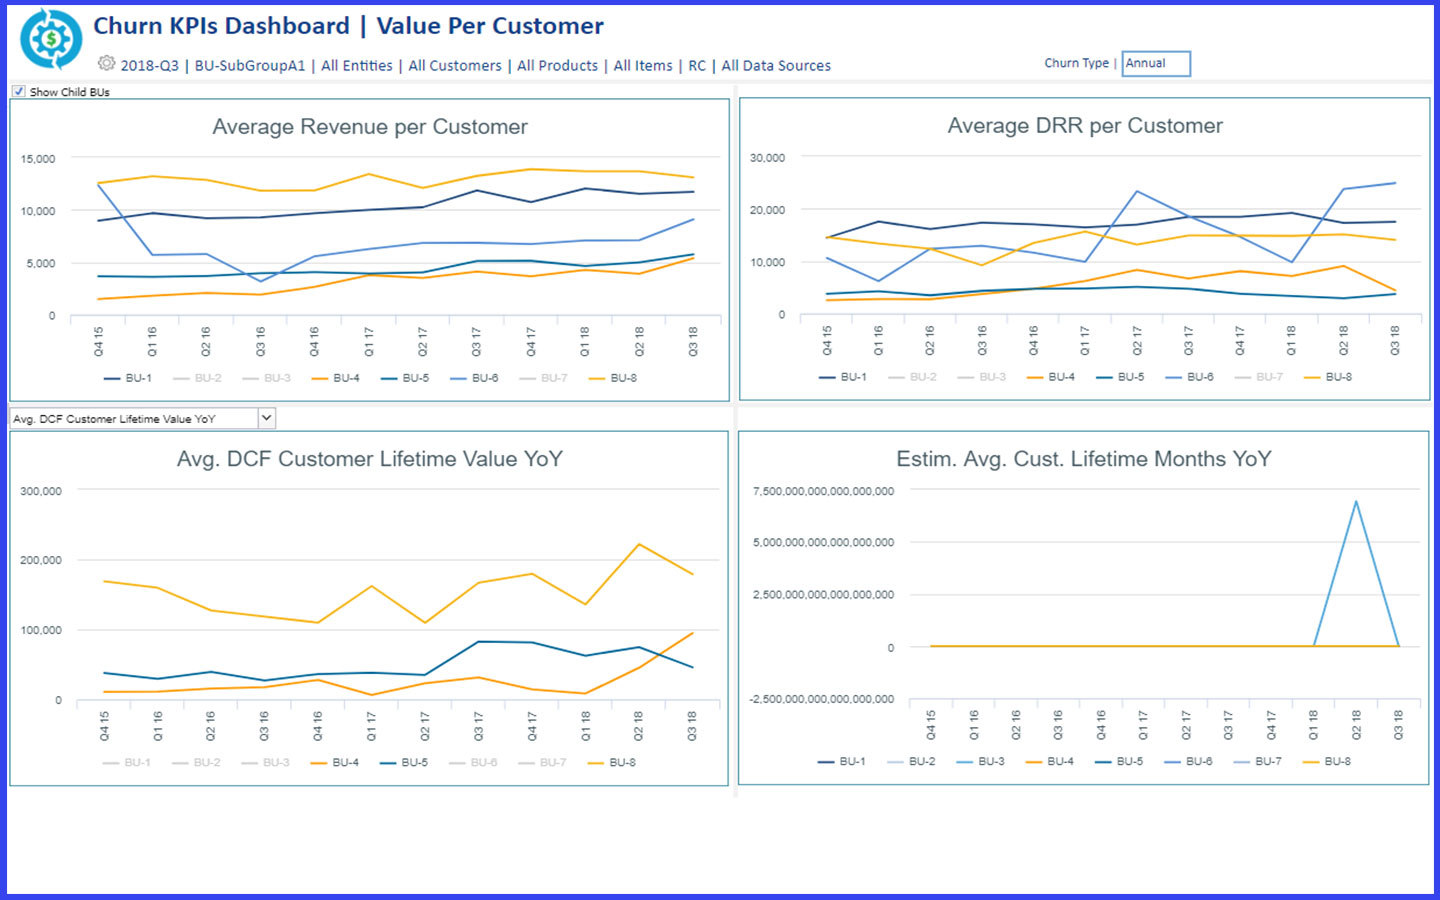
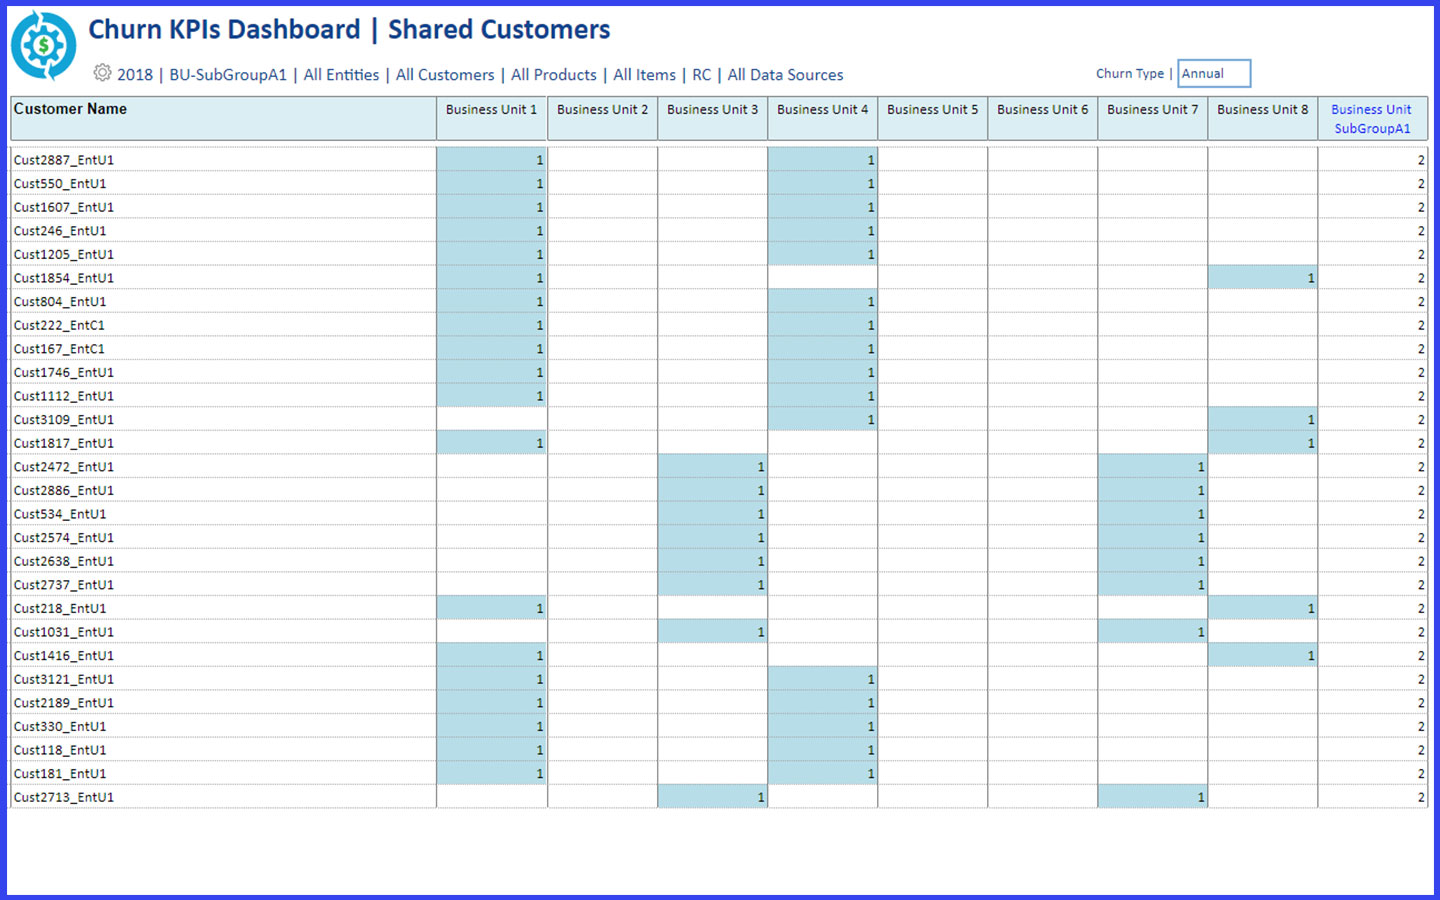
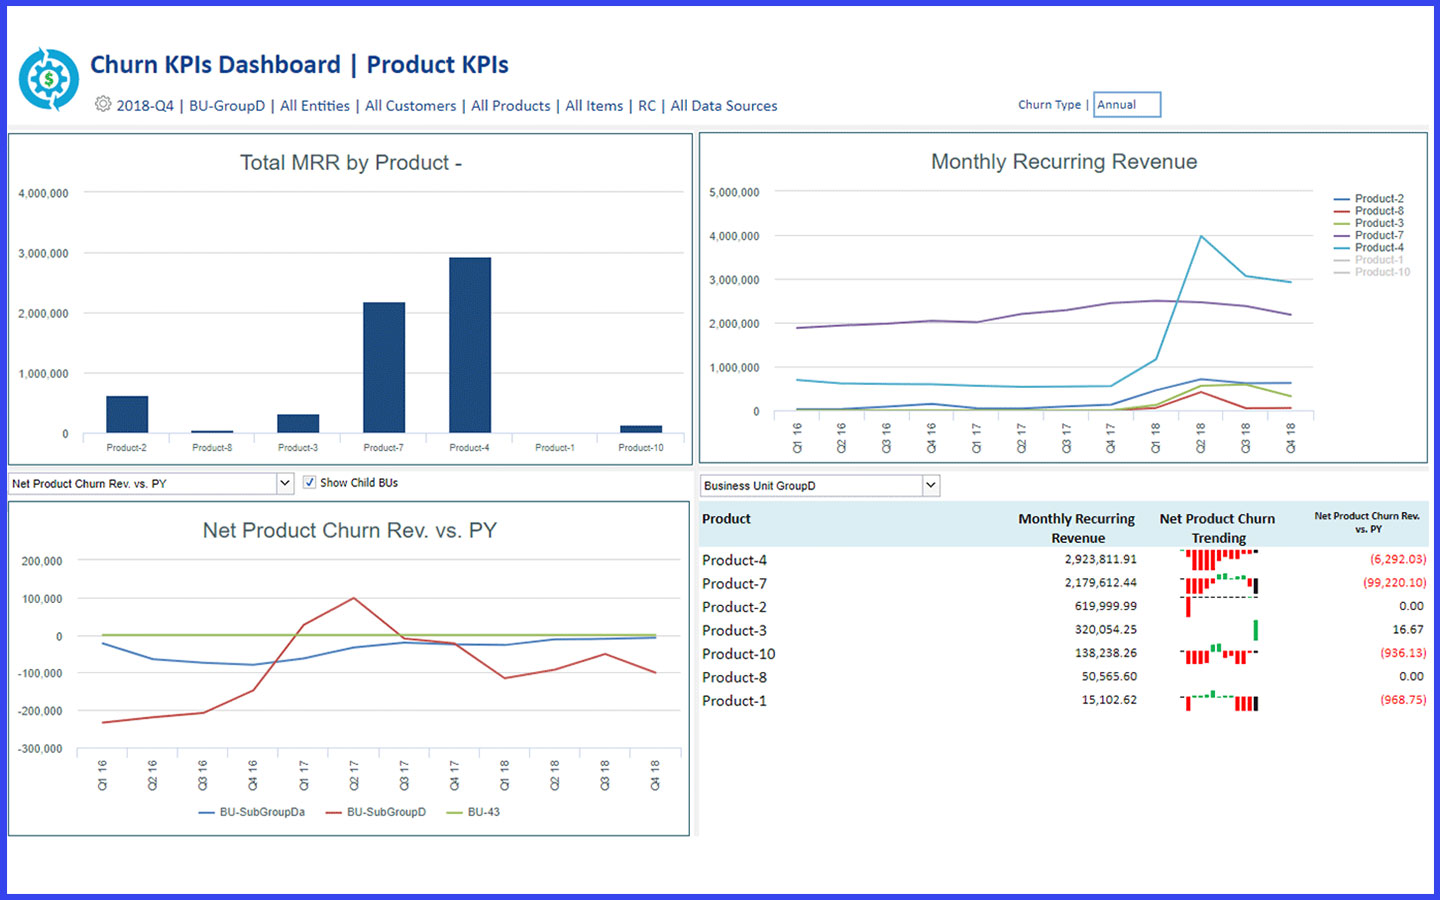
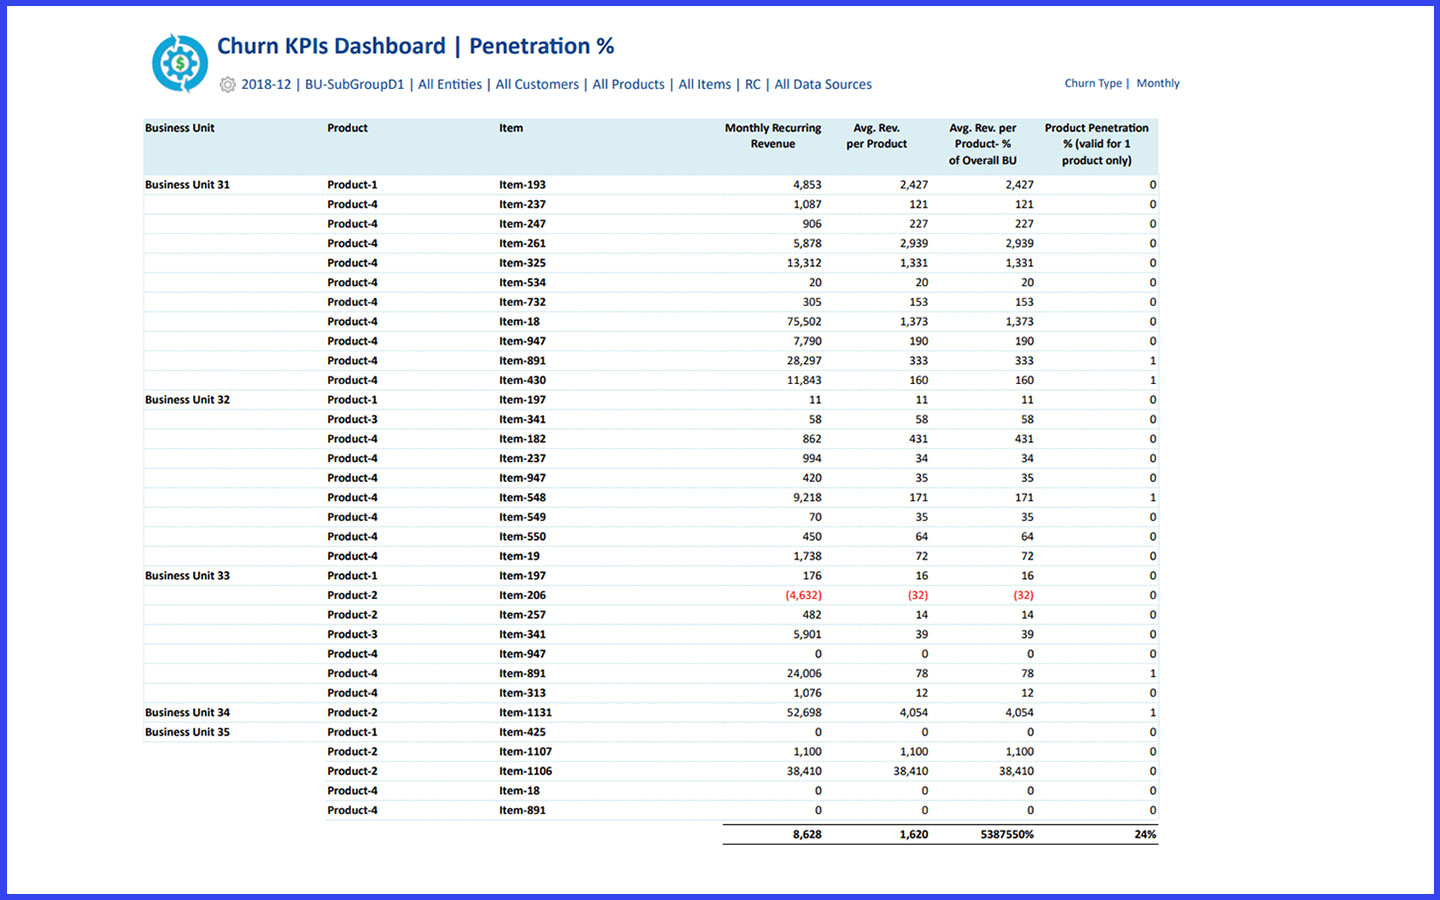
The MRR Churn application is loaded with hundreds of metrics and KPIs, and more continue to be added as the core model expands in depth and scope to cover additional data sources. One of the primary ways to highlight both absolute and relative KPI performance levels is to benchmark a BU against other BUs, and that is the primary theme of this set of dashboards.
And >400 more KPIs focused only on breaking down MRR (YoY and MoM, both by change amount and change %)


