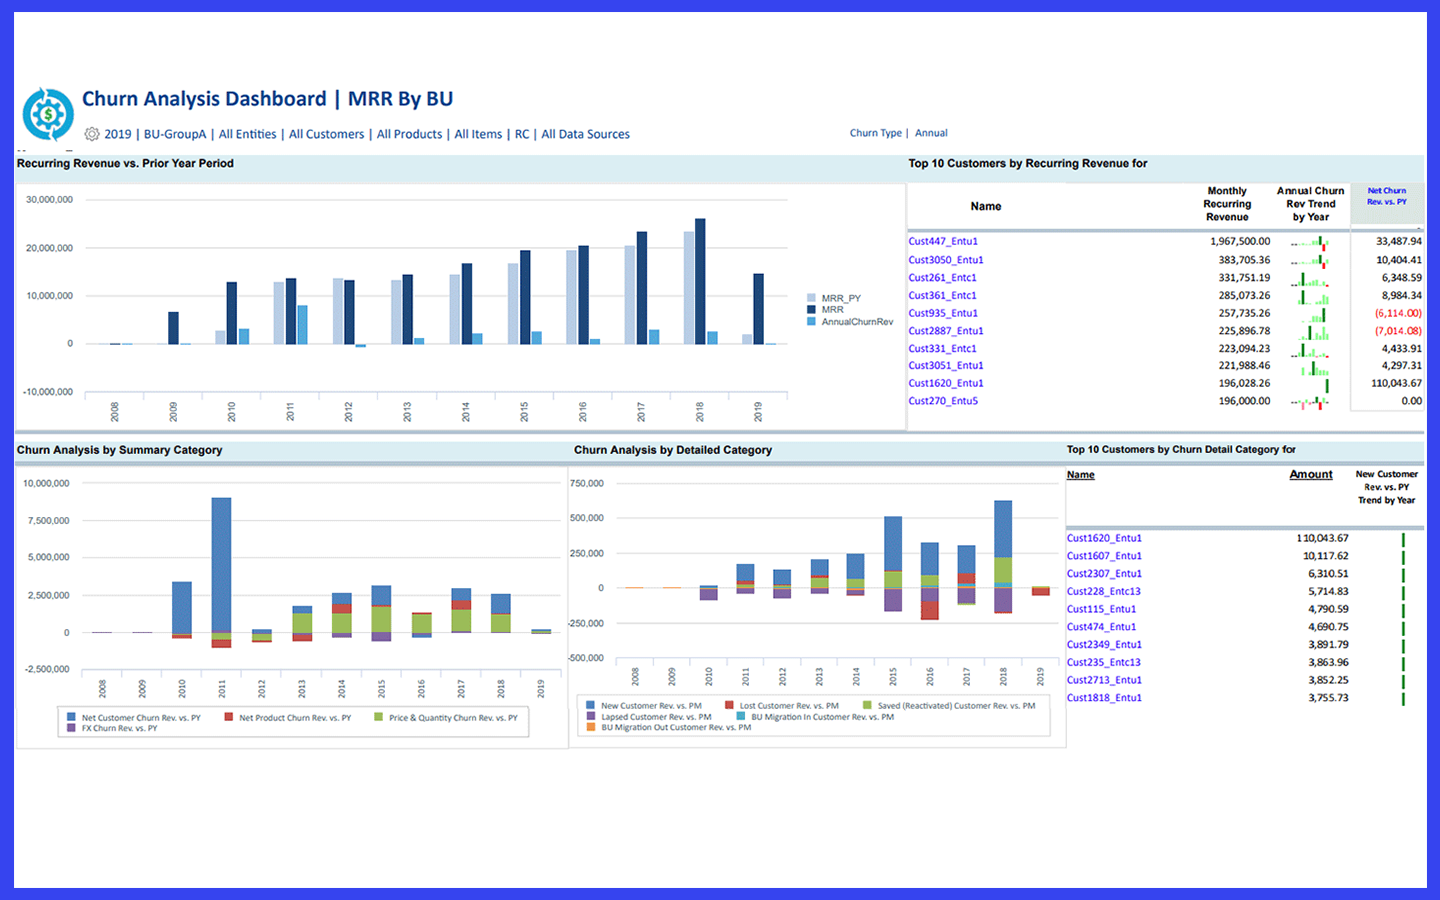
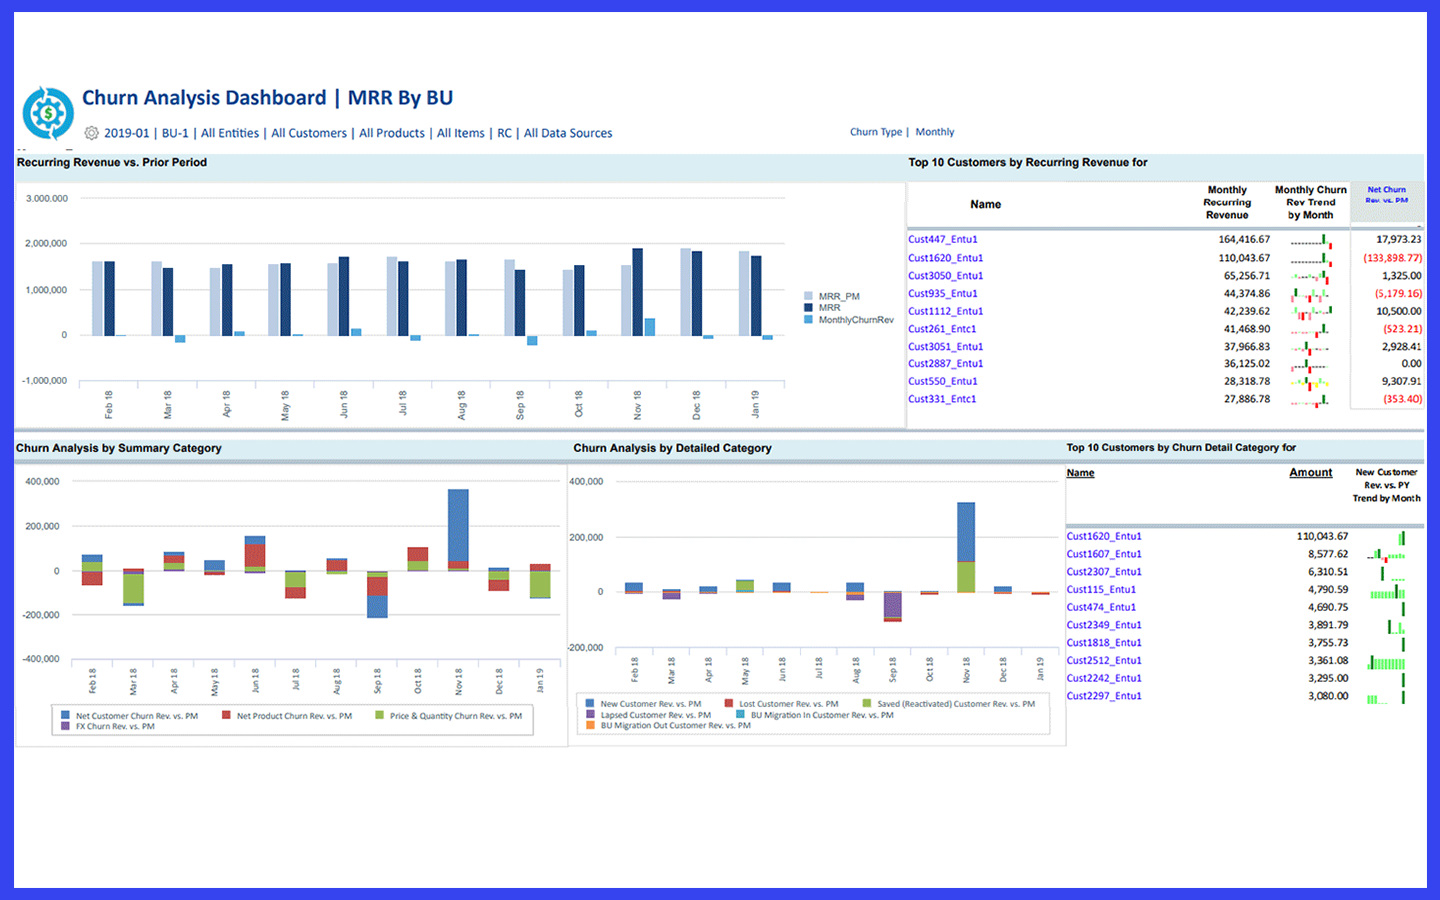
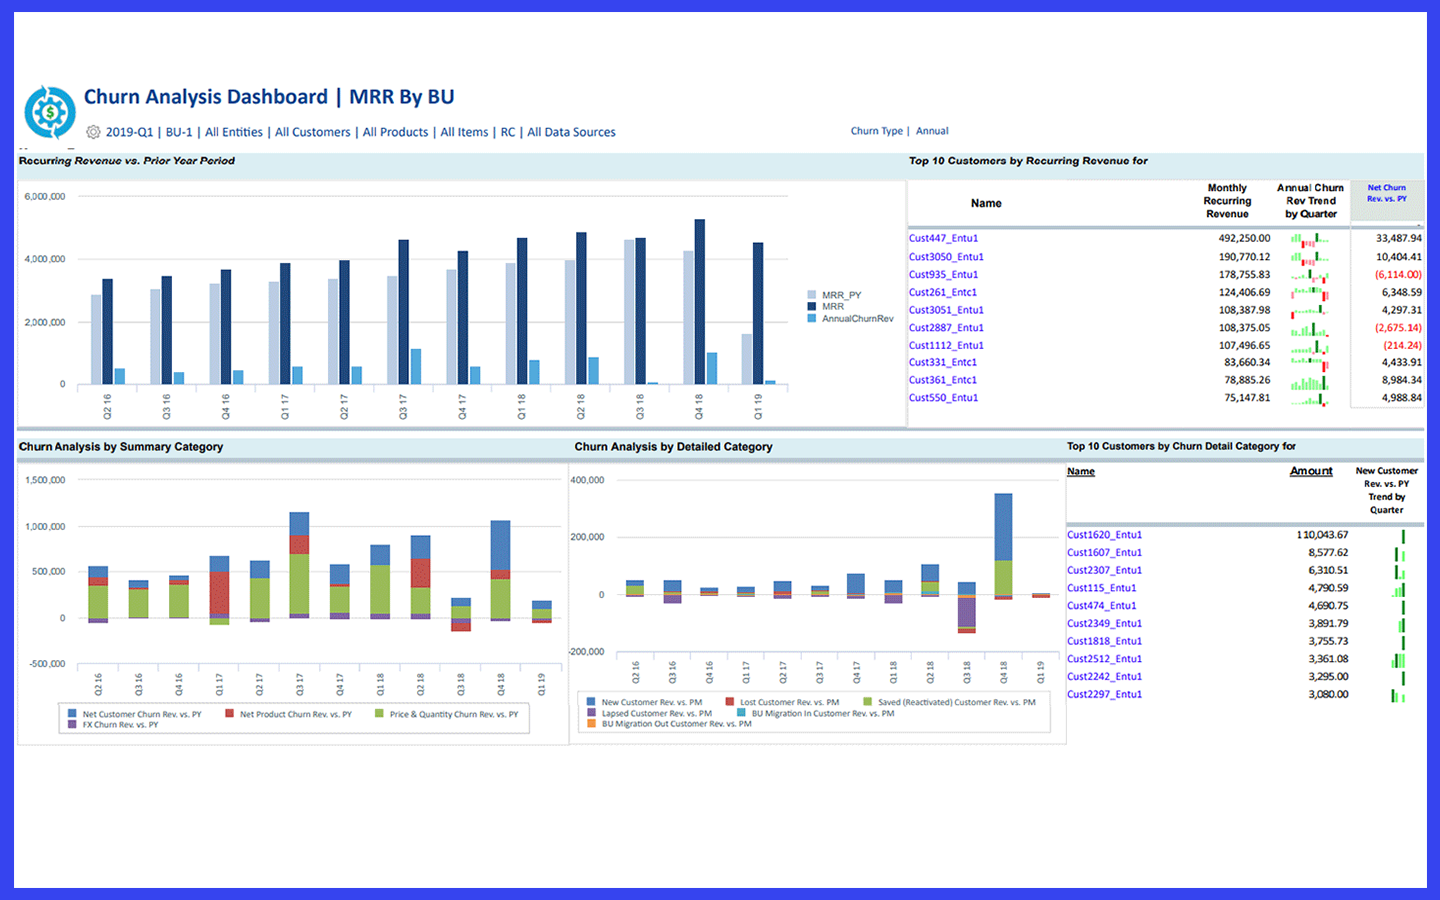
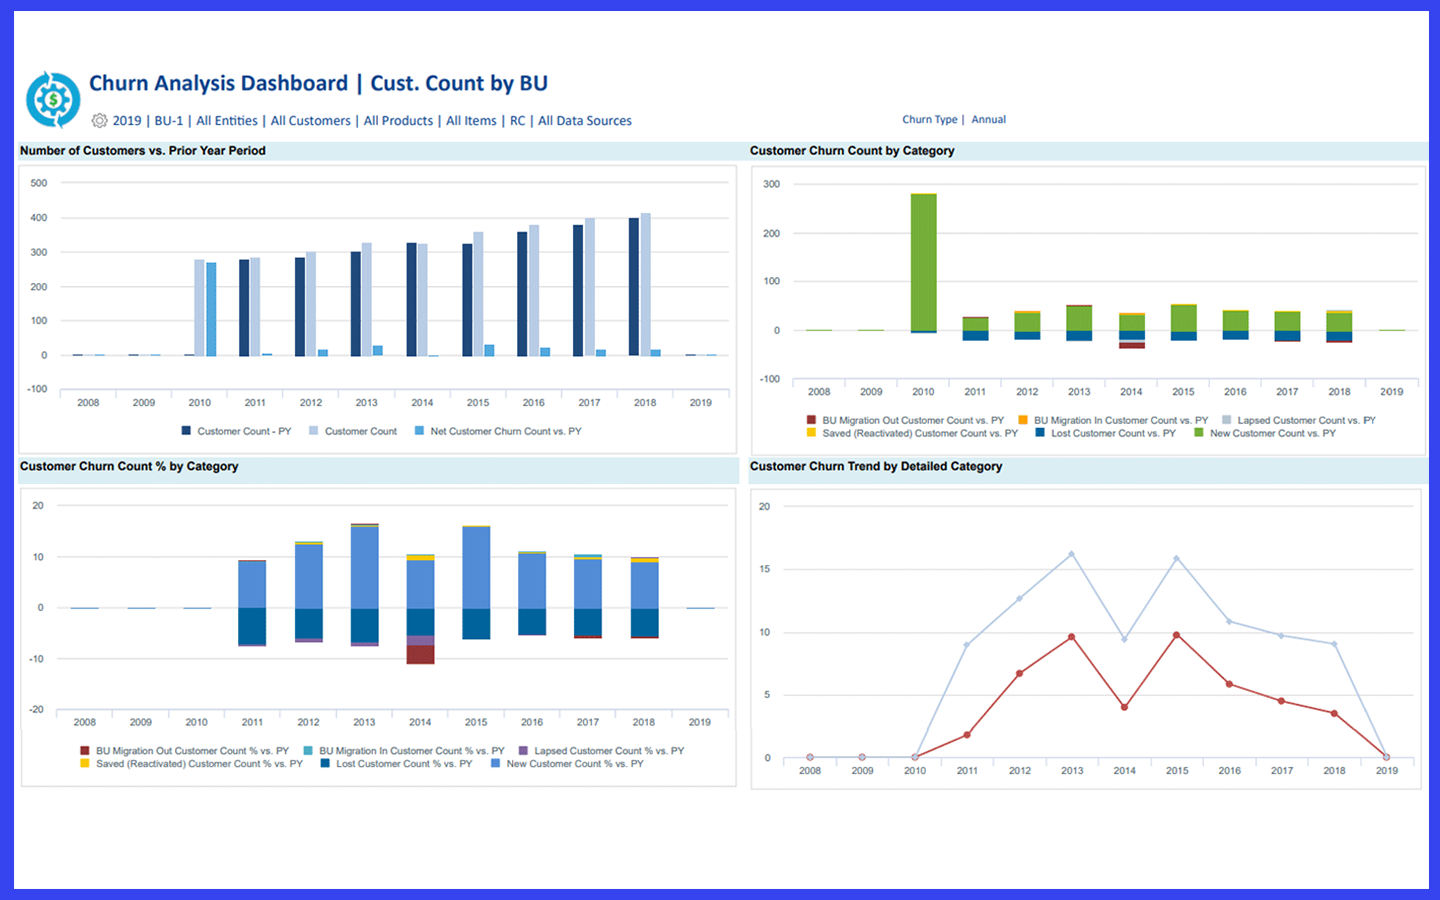
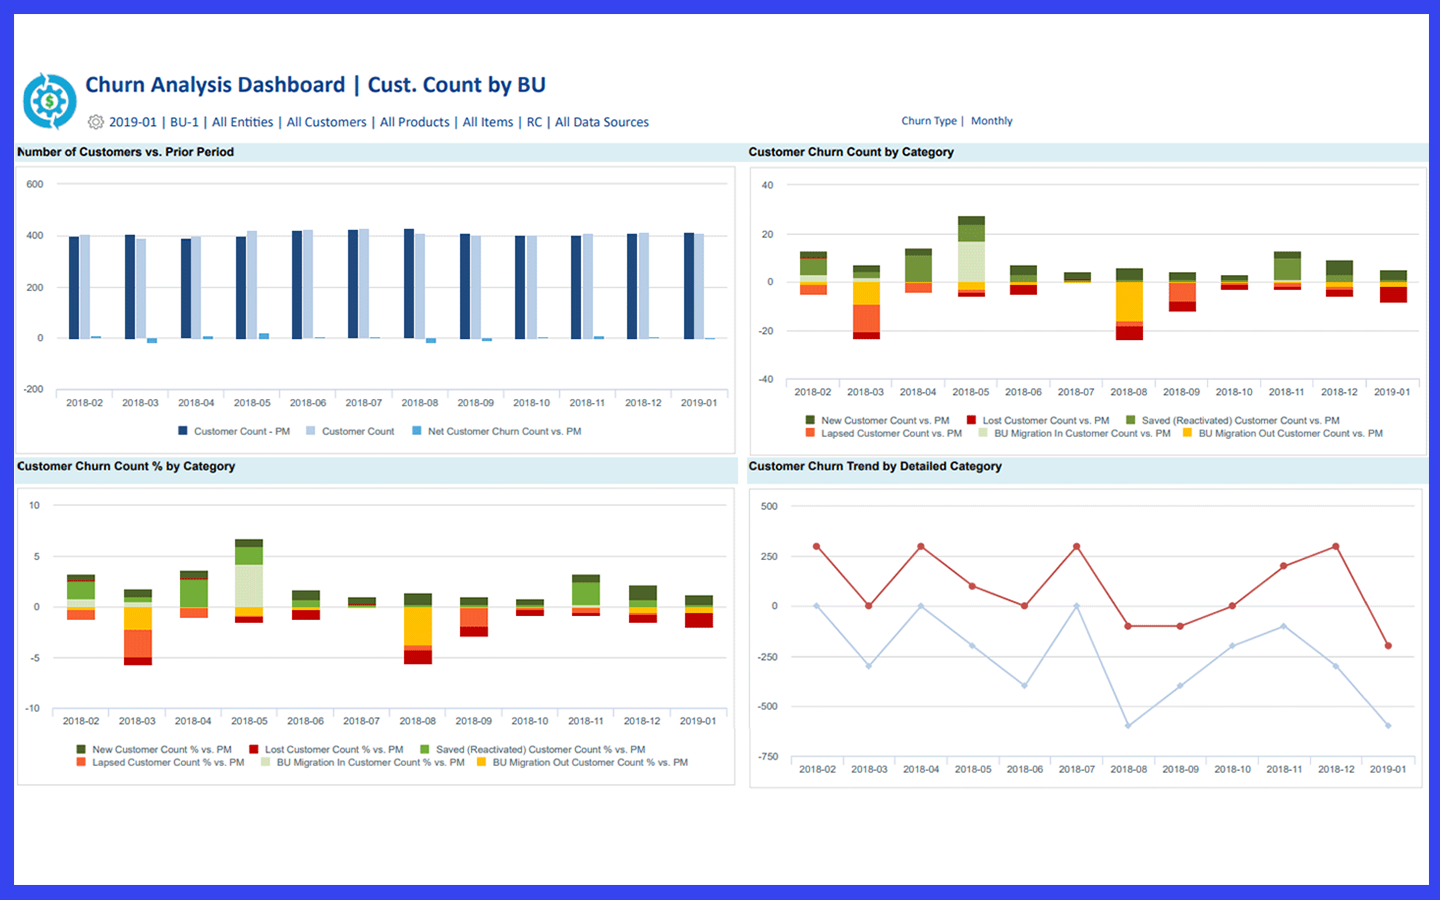
Churn analysis is the core functionality of the MRR Churn application. We take that analysis to a whole new level, both in term of the depth of granularity and in the enterprise-level scope of analysis across multiple BUs and legal entities. Every possible source of change in recurring revenue is isolated and tracked. Over 30 categories, or buckets, of MRR changes are captured for every month, quarter and year, both in terms of month-over-month changes and year-over year changes.
But why track MRR changes down to such excruciating detail? It is simple, really. If any source of change that you may not care as much about is not correctly isolated, then it will, by mathematical necessity, distort the measurement of one or more other sources of change that you definitely do care about. For example, we capture and analyze all recurring revenue in the originating currency (OC) that is actually billed, and we use our own very accurate FX translation engine to convert OC amounts to both the local currency (“LC”) and reporting currency (“RC”) of each legal entity at monthly average or ending rates, depending on which is applicable. That way, all FX impacts on MRR (and DRR) – even when otherwise buried within the LC numbers of the GL – can be completely isolated from all other MRR (and DRR) fluctuations. So, although you may not care as much about uncontrollable MRR fluctuations caused by FX rate changes – or even by partial months of recognition – you most likely care very much about accurately measuring price increases and decreases, quantity increases and decreases, product mix changes, product-specific lapses and reactivations, etc. Unfortunately, there is no shortcut to accuracy in any change category without a rigorous tracking of all potential sources of MRR (and DRR) changes.
Another major issue is how to accurately measure active customer counts, including what is a “new” or “lost” customer vs. a “saved” or “lapsed” customer. And the same applies to active product counts and “new” vs. “lost” products and “saved” vs. “lapsed” products” for each individual customer. There is also the issue of how to track acquired and divested customers, as well as acquired customers who may have also been lost or lapsed within the same year after acquisition. The latter is important to track for M&A due diligence to make sure that every customer that was paid for in an acquisition is a valid customer and was properly billed, with the correct recognition start date, post-acquisition. It is easy for such costly oversights to occur in an M&A transition process. Fortunately, once all sources of change in MRR are correctly isolated, this analysis is essentially fully automated as part of the larger net churn analysis.
With this extreme depth and breadth of net churn analysis data, from the most granular level to the most aggregate levels across multiple dimensions, a broad set of analytical methods and visualizations can be applied to extract a wealth of information. These include the following in the dashboards below, among many more possibilities:
- Graphical MRR trending by BU and net churn analysis drill downs
- Trending analysis by customer and product,
- Continuity analysis/reconciliations,
- Individual customer or customer segment churn analysis,
- Individual product or product segment churn analysis,
- Exception reporting and top customer monitoring,
- Top lost and lapsed customers for immediate follow-up,
- Loyal customer attrition analysis, and
- One-click drill-through analysis down to every invoice and invoice line item comprising any customer level MRR or billed amount in OC, LC or RC.

